Area Graph
Source: Data Visualisation Catalogue - Area Graph
Why This Belongs In The Compiler Gallery
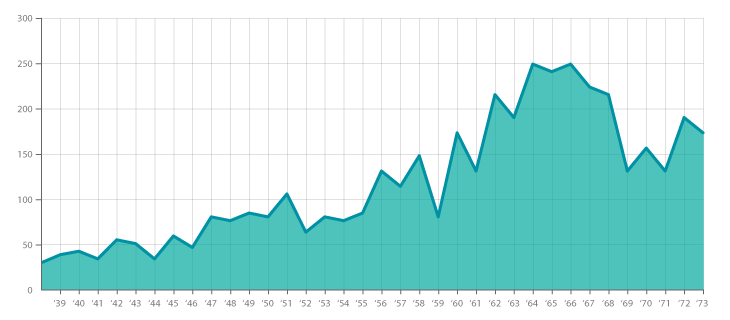
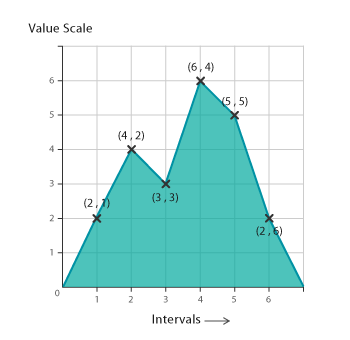
The catalogue describes an area graph as a line graph with the space below the line filled. That maps cleanly to the compiler's path glyph with y0/y1 area-band geometry, plus optional line, point, and text guide layers. It is the simplest way to prove that the compiler can render both stroke-only paths and filled path regions from the same data.
Data Contract
Each data row represents one ordered point in a series.
| Field | Type | Purpose |
|---|---|---|
x or index | quantitative or temporal | Ordered position along the horizontal axis. |
value | quantitative | Height of the area at that position. |
label | text or temporal | Axis/tooltip label. |
series | categorical, optional | Enables grouped area graphs. |
formattedValue | text, optional | Label/tooltip display. |
baseline | quantitative, optional | Non-zero baseline when the area should close to something other than zero. |
Expected Visual
The faithful catalogue version should show a Cartesian plot with an ordered line moving left to right and a semi-opaque filled area between the line and the zero baseline. The fill should read as secondary context, with the line stroke carrying the primary trend. The reference image uses a single blue area, a distinct top boundary, and simple x/y guide axes.
| Element | Expected treatment |
|---|---|
| Area fill | Closed path from each point to a common baseline, with moderate opacity. |
| Trend edge | Same point sequence as the area, drawn as a stronger stroke above the fill. |
| Baseline | Usually y = 0, visible through axis/grid context. |
| Axes | Linear y scale; time/order x scale. |
| Labels | Sparse tick labels, no dense point labels. |
Compiler Mapping
| Compiler part | Mapping |
|---|---|
| Data source | points table sorted by index or temporal order. |
| Transform | Optional sample for hover points; no transform needed for a single series. |
| Scales | x: linear, y: linear, optional color: ordinal for grouped series. |
| Layers | path area with fill, y0: 0, and y1: value; path line with stroke; optional point hit targets; generated or manual guide layers. |
| Interaction | Hover point should expose source row and resolved x/y/value lineage. |
Faithfulness Notes
The path glyph can still close an area to one constant y value, but the gallery now uses the more general area-band form. That same primitive supports Stacked Area Graphs, range fills, and the density plot's baseline-filled distribution.