Bar Chart
Source: Data Visualisation Catalogue - Bar Chart
Why This Belongs In The Compiler Gallery
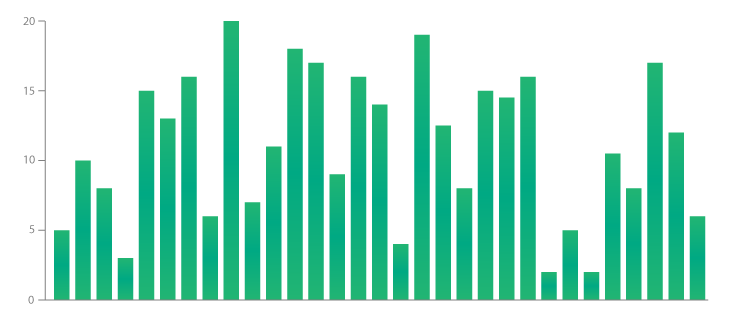
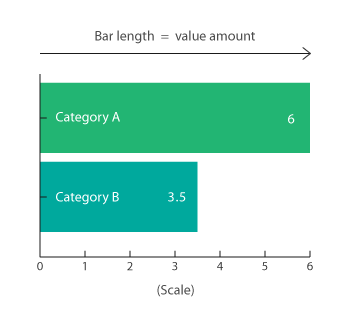
The catalogue frames bar charts as discrete numerical comparisons across categories. This is the compiler's most direct fit: categorical band position, linear value scale, rect bars, guide lines, and text labels. A faithful implementation also provides the baseline against which grouped, stacked, histogram, and population-pyramid variants can be compared.
Data Contract
Each data row represents one category.
| Field | Type | Purpose |
|---|---|---|
category or label | categorical | Discrete bar category. |
value | quantitative | Bar length or height. |
formattedValue | text, optional | End label and tooltip value. |
series | categorical, optional | Color grouping when bars are filtered or faceted. |
sortOrder | ordinal or quantitative, optional | Explicit category ordering. |
Expected Visual
The catalogue reference uses vertical columns, but the compiler gallery can support vertical or horizontal orientation. Faithful reproduction should keep discrete categories separated by consistent gaps, align all bars to a shared zero baseline, and use one continuous quantitative axis.
| Element | Expected treatment |
|---|---|
| Bars | Rects with equal width in vertical mode or equal height in horizontal mode. |
| Baseline | Shared zero line. Negative values should extend opposite the positive direction. |
| Axis | One categorical axis and one quantitative value axis. |
| Labels | Category labels on the band axis; optional value labels outside or above bars. |
| Color | Single fill by default; categorical color only when it encodes data. |
Compiler Mapping
| Compiler part | Mapping |
|---|---|
| Data source | bars table. |
| Transform | Optional aggregate when raw rows need count/sum by category. |
| Scales | x: band, y: linear for vertical; swap for horizontal. |
| Layers | rect bars, line baseline/grid, text category and value labels. |
| Interaction | Bar hover should return category, value, and source rows. |
Faithfulness Notes
The catalogue distinguishes bar charts from histograms because bars compare discrete categories rather than continuous bins. The gallery should keep that distinction in the docs, labels, and sample data. Do not reuse histogram bin labels for bar categories.