Multi-set Bar Chart
Source: Data Visualisation Catalogue - Multi-set Bar Chart

Why This Belongs In The Compiler Gallery
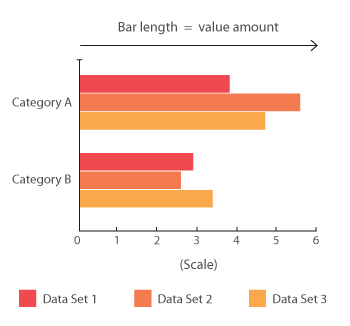
The catalogue describes multi-set bar charts as grouped bars: multiple series plotted on the same axis and grouped into parent categories. This extends the current bar primitive without requiring a new mark type. It is also a necessary counterpart to stacked bars because both encode parent category plus subcategory.
Data Contract
Each data row represents one subcategory bar inside a parent group.
| Field | Type | Purpose |
|---|---|---|
category | categorical | Parent group. |
series | categorical | Bar inside the group. |
value | quantitative | Bar height or length. |
formattedValue | text, optional | Value label and tooltip. |
categoryOrder | ordinal, optional | Parent group order. |
seriesOrder | ordinal, optional | Order inside each group. |
Expected Visual
The faithful catalogue version should show bars of equal width clustered by parent category. Bars in a cluster sit side by side and use color to distinguish series. Clusters are separated by a larger gap than bars within the same cluster.
| Element | Expected treatment |
|---|---|
| Bars | Rects arranged in parent groups with inner series offsets. |
| Group gap | Larger than the gap between sibling bars. |
| Series color | Ordinal palette keyed by series. |
| Axis | Shared quantitative baseline for all series. |
| Legend | Needed when color encodes series. |
Compiler Mapping
| Compiler part | Mapping |
|---|---|
| Data source | raw-grouped-bars input table and derived grouped-bars/group-labels tables. |
| Transform | layout with layoutKind: "groupedBand" derives bar x, width, and group centers. |
| Scales | y: linear, color: ordinal; x positions currently come from the grouped layout transform. |
| Layers | rect bars, text group labels, text optional values, line baseline/grid. |
| Interaction | Hover should expose category, series, value, and source row. |
Faithfulness Notes
The gallery implementation now uses compiler-owned grouped layout rather than fixture x/width values in source rows, and the series legend is generated from the ordinal color scale. A future nested band scale would make the layout more general and would let grouped categorical composition share the same guide and scale machinery as simpler bar charts.