Heatmap
Source: Data Visualisation Catalogue - Heatmap
Why This Belongs In The Compiler Gallery
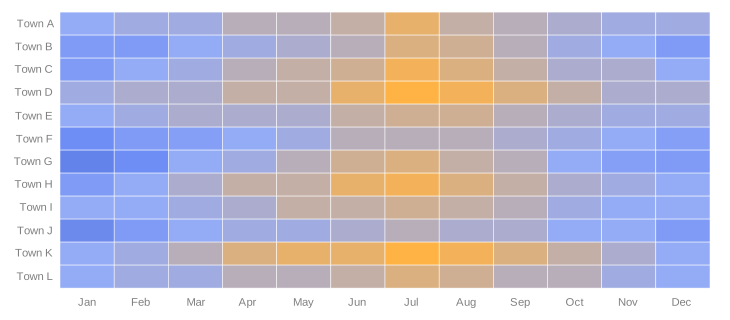
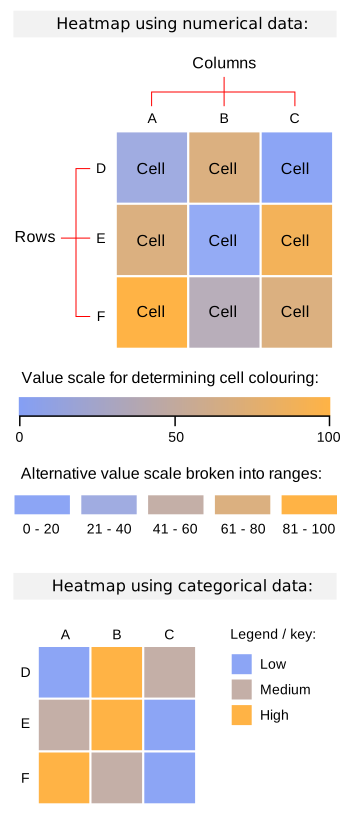
The catalogue heatmap is a matrix: row category by column category, with cell color encoding a categorical or quantitative value. The compiler already has a heatmap gallery example using band scales, rect cells, text labels, and a sequential color scale.
Data Contract
Each data row represents one matrix cell.
| Field | Type | Purpose |
|---|---|---|
row | categorical | Matrix row. |
column | categorical | Matrix column. |
value | quantitative or categorical | Encoded cell value. |
formattedValue | text, optional | In-cell label and tooltip value. |
rowOrder | ordinal, optional | Explicit row ordering. |
columnOrder | ordinal, optional | Explicit column ordering. |
Expected Visual
A faithful catalogue heatmap should render a rectangular grid with one colored cell at every row/column intersection. Row labels sit along one side and column labels sit along the top or bottom. If the value is quantitative, the color ramp needs a legend or clear scale. In-cell values are acceptable and help compensate for the imprecision of color comparison.
| Element | Expected treatment |
|---|---|
| Cells | Equal-size rects aligned into a matrix. |
| Color | Sequential ramp for quantitative values or ordinal palette for categories. |
| Labels | Row and column labels outside cells; optional values centered inside cells. |
| Gaps | Small, consistent gutters between cells. |
| Legend | Strongly recommended for quantitative ramps. |
Compiler Mapping
| Compiler part | Mapping |
|---|---|
| Data source | cells table plus derived row/column label tables. |
| Transform | aggregate or layout transform to derive unique row/column labels. |
| Scales | x: band, y: band, color: sequential or color: ordinal. |
| Layers | rect cells, text row labels, text column labels, optional text cell values, generated color legend. |
| Interaction | Cell hover should expose row, column, value, and source row. |
Faithfulness Notes
The current sequential scale maps values to discrete color steps, not a continuous gradient, and the legend is generated as stepped swatches from the same scale. That can still match the catalogue's "solid colours for value ranges" option. A continuous color interpolator would be needed only if the gallery target requires smooth gradient interpolation.