Bubble Chart
Source: Data Visualisation Catalogue - Bubble Chart
Why This Belongs In The Compiler Gallery
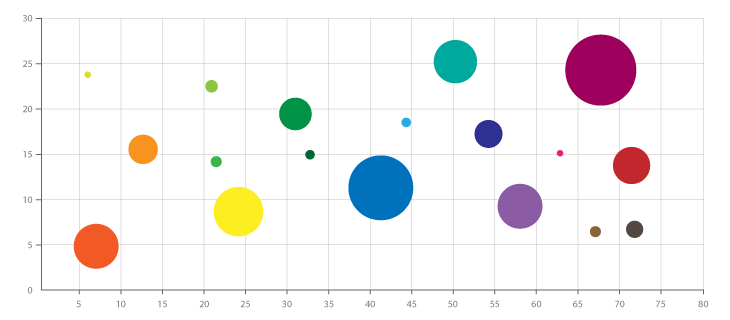
The catalogue defines bubble charts as scatterplots with circle area used for an additional variable. The compiler's point glyph already supports cx, cy, r, fill, stroke, and opacity, so this is a direct fit and a useful test for multi-channel quantitative encoding.
Data Contract
Each data row represents one bubble.
| Field | Type | Purpose |
|---|---|---|
x | quantitative | Horizontal position. |
y | quantitative | Vertical position. |
size | quantitative | Quantity encoded by circle area. |
label | text | Tooltip or visible label. |
category | categorical, optional | Fill color grouping. |
time | temporal, optional | Animation frame or filter. |
formattedSize | text, optional | Tooltip display for the size value. |
Expected Visual
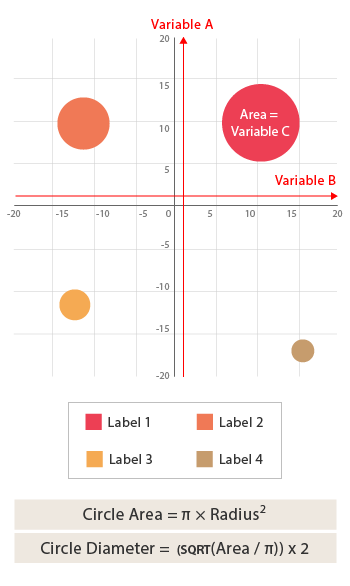
The chart should place circles on a Cartesian grid. Circle position encodes two variables and circle area encodes the third. The catalogue specifically warns that circle sizes must be based on area, not raw radius or diameter, so the radius scale should use sqrt(value) or an equivalent area-correct mapping.
| Element | Expected treatment |
|---|---|
| Bubbles | Circles with radius derived from area-scaled values. |
| Axes | Two quantitative linear axes. |
| Color | Optional categorical fill; do not add color unless it encodes a field. |
| Overlap | Use opacity and stroke to keep overlapping bubbles readable. |
| Labels | Prefer hover/tooltips for dense charts; visible labels only for sparse examples. |
Compiler Mapping
| Compiler part | Mapping |
|---|---|
| Data source | bubbles table. |
| Transform | No radius precomputation needed for the current gallery example. |
| Scales | x: linear, y: linear, r: sqrt(size), color: ordinal. |
| Layers | point bubbles, optional line grid, optional text labels. |
| Interaction | Hover should expose x, y, size, category, and source row. |
Faithfulness Notes
The gallery implementation uses a first-class sqrt radius scale, so raw size values map to area-correct circle radii without a fixture radius field. The size legend is now generated from that same radius scale. Remaining polish is overlap/collision handling for denser bubble charts.