Stacked Bar Graph
Source: Data Visualisation Catalogue - Stacked Bar Graph
Why This Belongs In The Compiler Gallery
The catalogue defines stacked bar graphs as segmented bars used to show how a larger category divides into smaller subcategories. The compiler already has a stack transform and rect segment rendering, so this is a direct fit.
Data Contract
Each raw data row represents one subcategory value inside a parent category.
| Field | Type | Purpose |
|---|---|---|
category | categorical | Parent bar. |
series | categorical | Segment within the bar. |
value | quantitative | Segment magnitude. |
start | quantitative, derived | Stack start position. |
end | quantitative, derived | Stack end position. |
percentStart | quantitative, derived | Start for 100 percent stack mode. |
percentEnd | quantitative, derived | End for 100 percent stack mode. |
Expected Visual
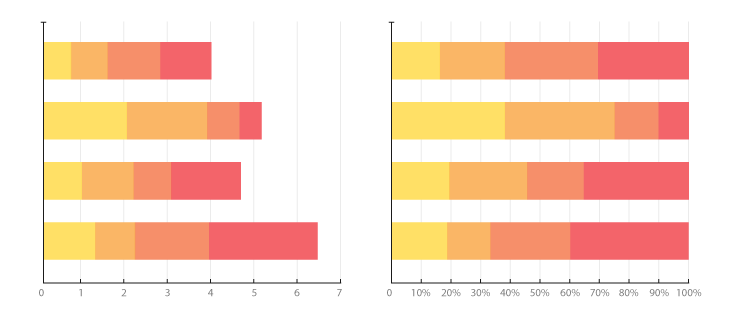
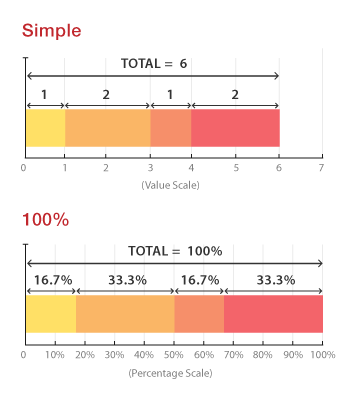
The faithful catalogue version should show each category as one bar split into adjacent colored segments. The simple stacked version uses absolute values and different total bar lengths. The 100 percent version normalizes every bar to the same full length and compares relative composition.
| Element | Expected treatment |
|---|---|
| Segments | Rects using start and end bounds on a shared scale. |
| Color | Ordinal palette keyed by series. |
| Baseline | All parent bars share a common zero baseline. |
| Labels | Parent category labels; optional segment or total labels. |
| Legend | Needed for segment colors. |
Compiler Mapping
| Compiler part | Mapping |
|---|---|
| Data source | raw-stacks and derived segments. |
| Transform | stack to compute start/end; optional normalize mode for 100 percent stacks. |
| Scales | x: linear, y: band, color: ordinal for horizontal; swap x/y for vertical. |
| Layers | rect segment glyphs, text parent labels, optional total/segment labels, line guides. |
| Interaction | Segment hover should expose category, series, value, and segment bounds. |
Faithfulness Notes
The catalogue warns that segment comparison is hard because most segments do not share a baseline. The gallery should surface that by keeping simple stacks for part-to-whole and using grouped bars when the task is direct subcategory comparison.