Histogram
Source: Data Visualisation Catalogue - Histogram
Why This Belongs In The Compiler Gallery
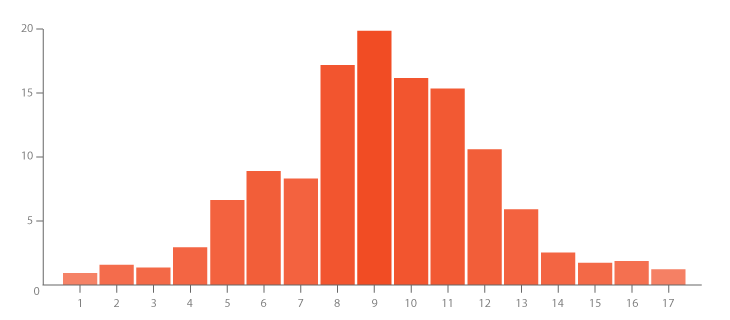
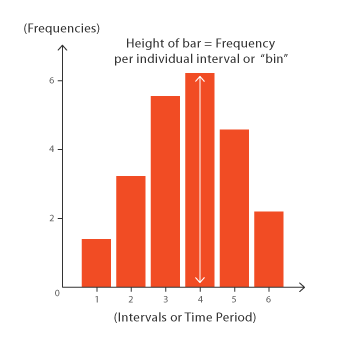
The catalogue defines histograms as distributions over continuous intervals. The compiler already models a bin transform and vertical rect bars, making this a direct fit and an important contrast with categorical bar charts.
Data Contract
Input can be raw observations or pre-binned intervals.
| Field | Type | Purpose |
|---|---|---|
value | quantitative | Continuous measure to bin when starting from raw observations. |
min | quantitative, derived | Inclusive lower bound for compiler-generated bins. |
max | quantitative, derived | Upper bound for compiler-generated bins. |
count | quantitative | Frequency in the bin. |
label | text | Human-readable bin label. |
Expected Visual
The faithful visual should show contiguous or nearly contiguous bars along a continuous x axis. Bar height encodes count/frequency. Unlike a bar chart, the horizontal position represents an interval, not a category. The catalogue reference uses vertical columns with simple guide axes.
| Element | Expected treatment |
|---|---|
| Bars | Rects representing interval bins; gaps should be minimal. |
| X axis | Continuous interval labels or tick marks. |
| Y axis | Count or frequency. |
| Sorting | Always by bin start, not by count. |
| Labels | Optional count labels; avoid treating bins as unordered categories. |
Compiler Mapping
| Compiler part | Mapping |
|---|---|
| Data source | observations raw table and bins output table. |
| Transform | bin from raw values to count rows. |
| Scales | x: linear over bin bounds; y: linear. |
| Layers | rect bins, line grid/baseline, text bin labels and optional count labels. |
| Interaction | Bin hover should expose interval, count, and contributing source rows. |
Faithfulness Notes
The gallery histogram now renders compiler-generated bins with x0/x1 from a linear scale, which keeps the bar-chart/histogram distinction intact. Remaining polish is tick formatting for interval labels and optional density/frequency normalization.