Line Graph
Source: Data Visualisation Catalogue - Line Graph
Why This Belongs In The Compiler Gallery
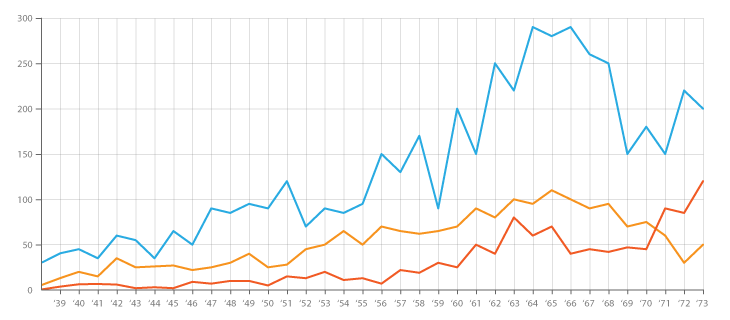
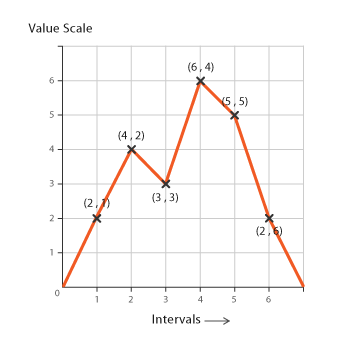
The catalogue describes a line graph as ordered quantitative values joined on a Cartesian grid, most often over time. The compiler already has a path glyph that groups sorted rows, plus optional point glyphs for inspected samples.
Data Contract
Each data row represents one ordered point.
| Field | Type | Purpose |
|---|---|---|
x or index | quantitative or temporal | Ordered horizontal position. |
value | quantitative | Vertical value. |
label | text or temporal | Display label. |
series | categorical, optional | Multiple lines in one chart. |
formattedValue | text, optional | Tooltip/label display. |
isSampled | boolean, optional | Whether to render a visible point marker. |
Expected Visual
A faithful line graph should show a continuous path through ordered points, with the path direction carrying trend information. The catalogue notes that grouped line charts become hard to read beyond a few series, so the first gallery example should use one line or a small number of clearly colored lines.
| Element | Expected treatment |
|---|---|
| Line | Path through sorted x positions. |
| Points | Optional visible markers, useful for sparse or inspected points. |
| Axes | X axis as time/order; y axis quantitative. |
| Grid | Light y-axis guides improve value reading. |
| Multiple series | Use groupBy: ["series"] and an ordinal color scale. |
Compiler Mapping
| Compiler part | Mapping |
|---|---|
| Data source | points table. |
| Transform | Optional sample transform for visible point markers. |
| Scales | x: linear, y: linear, optional color: ordinal. |
| Layers | path trend line, optional point markers, line grid, text axis labels. |
| Interaction | Point or path hover should expose ordered value and source row. |
Faithfulness Notes
The current path glyph uses straight line segments. That is faithful to the catalogue's basic line graph. Smooth curve interpolation should be a separate option, not the default.